Graph coloring refers to the problem of coloring vertices of a graph in such a way that no two adjacent vertices have the same color. This is also called the vertex coloring problem.
- If coloring is done using at most k colors, it is called k-coloring.
- The smallest number of colors required for coloring graph is called its chromatic number.
- The chromatic number is denoted by X(G). Finding the chromatic number for the graph is NP-complete problem.
- Graph coloring problem is both, decision problem as well as an optimization problem. A decision problem is stated as, “With given M colors and graph G, whether such color scheme is possible or not?”.
- The optimization problem is stated as, “Given M colors and graph G, find the minimum number of colors required for graph coloring.”
- Graph coloring problem is a very interesting problem of graph theory and it has many diverse applications. Few of them are listed below.
- Design a timetable.
- Sudoku
- Register allocation in the compiler
- Map coloring
- Mobile radio frequency assignment:
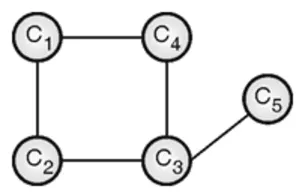
The input to the graph is an adjacency matrix representation of the graph. Value M(i, j) = 1 in the matrix represents there exists an edge between vertex i and j. A graph and its adjacency matrix representation are shown in Figure (a)
| C1 | C2 | C3 | C4 | C5 | |
| C1 | 0 | 1 | 0 | 1 | 0 |
| C2 | 1 | 0 | 1 | 0 | 0 |
| C3 | 0 | 1 | 0 | 1 | 1 |
| C4 | 1 | 0 | 1 | 0 | 1 |
| C5 | 0 | 0 | 1 | 0 | 0 |
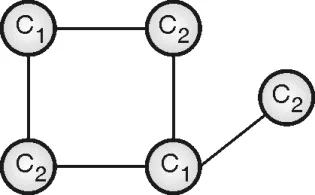
The problem can be solved simply by assigning a unique color to each vertex, but this solution is not optimal. It may be possible to color the graph with colors less than |V|. Figure (b) and figure (c) demonstrate both such instances. Let Ci denote the ith color.

- This problem can be solved using backtracking algorithms as follows:
- List down all the vertices and colors in two lists
- Assign color 1 to vertex 1
- If vertex 2 is not adjacent to vertex 1 then assign the same color, otherwise assign color 2.
- Repeat the process until all vertices are colored.
- Algorithm backtracks whenever color i is not possible to assign to any vertex k and it selects next color i + 1 and test is repeated. Consider the graph shown in
Figure (d)
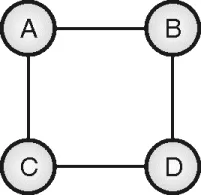
If we assign color 1 to vertex A, the same color cannot be assigned to vertex B or C. In the next step, B is assigned some different colors 2. Vertex A is already colored and vertex D is a neighbor of B, so D cannot be assigned color 2. The process goes on. State-space tree is shown in Figure (e)
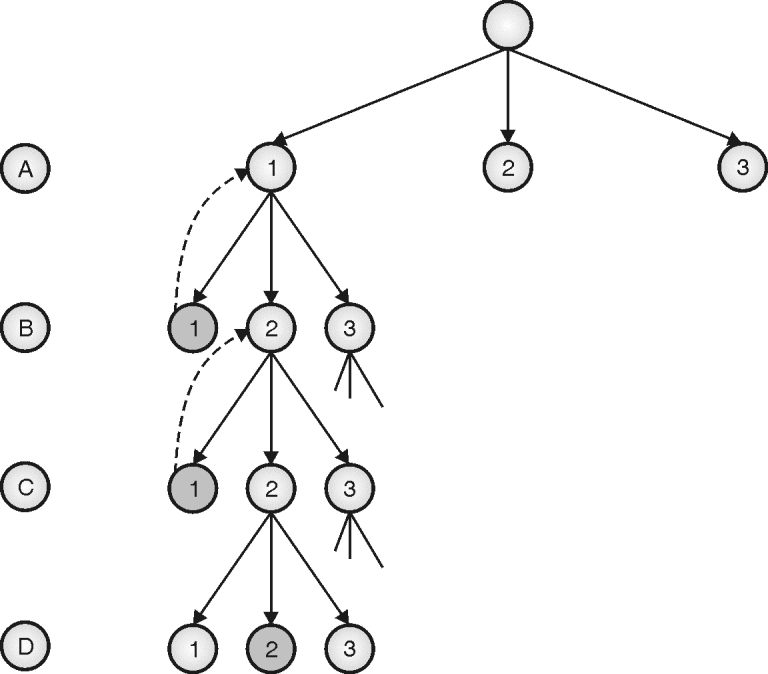
Thus, vertices A and C will be colored with color 1, and vertices B and D will be colored with color 2.
The algorithm for graph coloring:
Algorithm
Complexity Analysis
The number of anode increases exponentially at every level in state space tree. With M colors and n vertices, total number of nodes in state space tree would be
1 + M + M2 + M3 + …. + Mn
Hence, T(n) = 1 + M + M2 + M3 + …. + Mn
So, T(n) = O(Mn).
Thus, the graph coloring algorithm runs in exponential time.
Planar Graphs
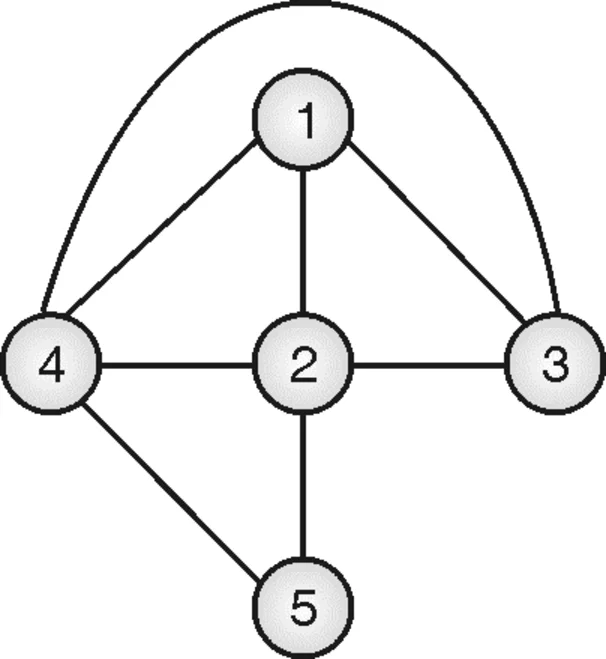
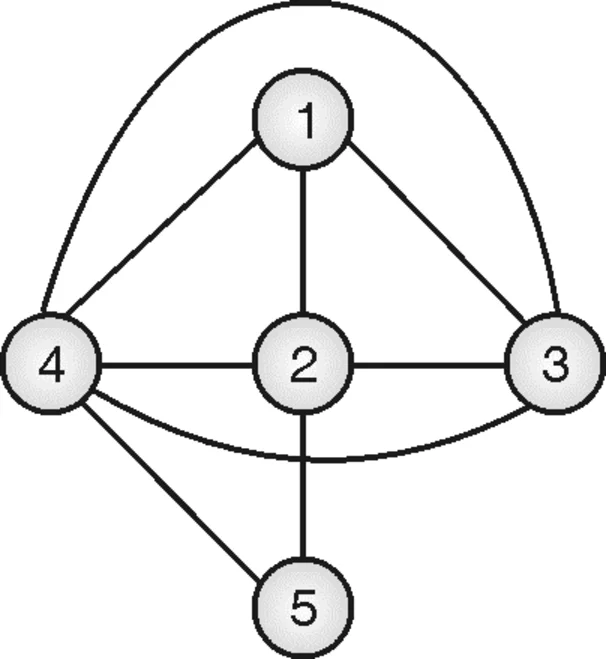
- A graph is called planar if it can be drawn on a 2D plane such that no two edges cross each other. The graph coloring problem is a well-known problem of a planar graph.
- Planar and non-planar graphs are illustrated in Fig. (f) & Fig. (g)
Bipartite graph
- Graph G is said to be a bipartite graph if we can divide the vertices of graph G into two disjoint sets, U and V such that each edge connects a vertex in U to one vertex in V. Disjoint independent sets, U and V are called partite sets. If we cut the edges with vertical lines, all vertices become isolated vertices. Fig. (h) describes the bipartite graph.
- It is intuitive from the figure that we need a maximum of two colors for graph coloring problem if the graph is bipartite. None of the vertexes in U and V is connected to any other vertex in the set itself.
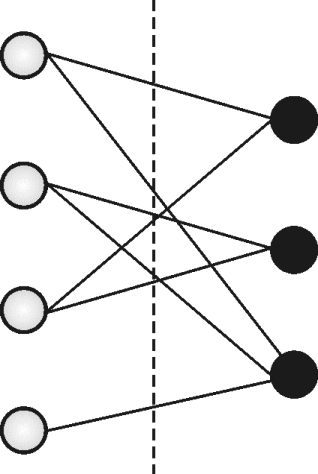
All vertices in U can be colored using one color as there is no adjacency between vertices. Similarly, vertices in V can be colored using one color. Thus, a bipartite graph needs only two colors for graph coloring problems.
Examples on Graph Coloring Problem
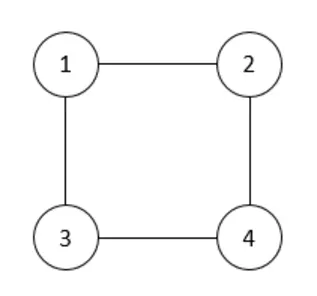
Example: Apply backtrack on the following instance of graph coloring problem of 4 nodes and 3 colors
Solution:
This problem can be solved using backtracking algorithms. The formal idea is to list down all the vertices and colors in two lists. Assign color 1 to vertex 1. If vertex 2 is not adjacent to vertex 1 then assign the same color, otherwise assign color 2. The process is repeated until all vertices are colored. The algorithm backtracks whenever color i is not possible to assign to any vertex k and it selects the next color i + 1 and the test is repeated. This graph can be colored with 3 colors. The solution tree is shown in Fig. (i):
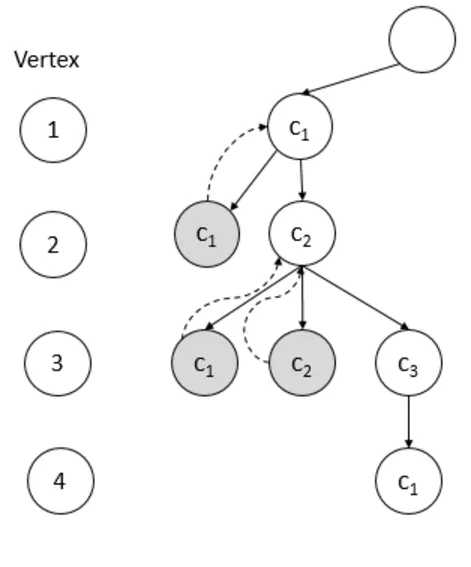
| Vertex | Assigned Color |
| 1 | c1 |
| 2 | c2 |
| 3 | c3 |
| 4 | c1 |
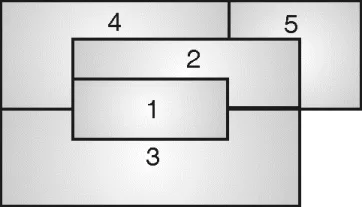
Example: Construct a planar graph for the following map. Explain how to find m-coloring of this planar graph by using an m-coloring Backtracking algorithm
Solution:
In Fig. (j), area 1 is adjacent to areas 2, 3, and 4. So, in a planar graph, vertex 1 will be connected to vertices 2, 3, and 4.
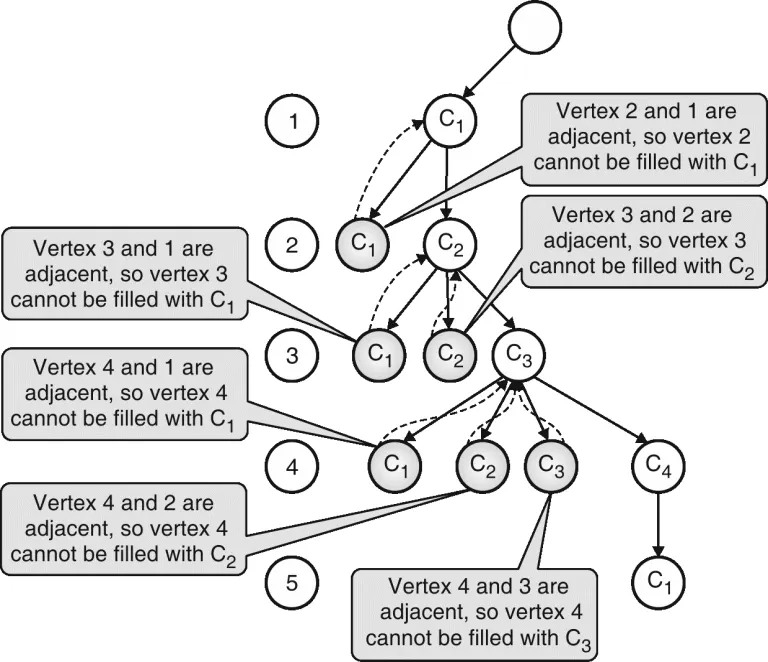
Area 2 is adjacent to areas 1, 3, 4, and 5, so in a planar graph, vertex 2 will be connected to vertices 1, 3, 4, and 5. This process will be repeated for all areas. Hence, the planar graph would be,

- This problem can be solved using backtracking algorithms as follows:
- List down all the vertices and colors in two lists
- Assign color 1 to vertex 1
- If vertex 2 is not adjacent to vertex 1 then assign the same color, otherwise assign color 2.
- Repeat the process until all vertices are colored.
The algorithm backtracks whenever color i is not possible to assign to any vertex k and it selects the next color i + 1 and the test is repeated. This graph can be colored using four different colors. A gray node indicates backtracking.


No comments:
Post a Comment