Bayesian Belief Network
Bayesian belief network is key computer technology for dealing with probabilistic events and to solve a problem which has uncertainty. We can define a Bayesian network as:
"A Bayesian network is a probabilistic graphical model which represents a set of variables and their conditional dependencies using a directed acyclic graph."
It is also called a Bayes network, belief network, decision network, or Bayesian model.
Bayesian networks are probabilistic, because these networks are built from a probability distribution, and also use probability theory for prediction and anomaly detection.
Real world applications are probabilistic in nature, and to represent the relationship between multiple events, we need a Bayesian network. It can also be used in various tasks including prediction, anomaly detection, diagnostics, automated insight, reasoning, time series prediction, and decision making under uncertainty.
Bayesian Network can be used for building models from data and experts opinions, and it consists of two parts:
- Directed Acyclic Graph
- Table of conditional probabilities.
The generalized form of Bayesian network that represents and solve decision problems under uncertain knowledge is known as an Influence diagram.
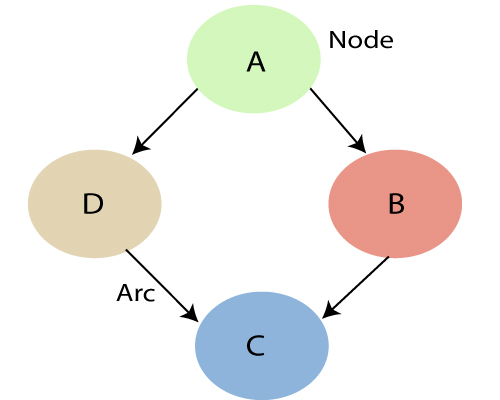
A Bayesian network graph is made up of nodes and Arcs (directed links), where:

- Each node corresponds to the random variables, and a variable can be continuous or discrete.
- Arc or directed arrows represent the causal relationship or conditional probabilities between random variables. These directed links or arrows connect the pair of nodes in the graph.
These links represent that one node directly influence the other node, and if there is no directed link that means that nodes are independent with each other- In the above diagram, A, B, C, and D are random variables represented by the nodes of the network graph.
- If we are considering node B, which is connected with node A by a directed arrow, then node A is called the parent of Node B.
- Node C is independent of node A.
Note: The Bayesian network graph does not contain any cyclic graph. Hence, it is known as a directed acyclic graph or DAG.
The Bayesian network has mainly two components:
- Causal Component
- Actual numbers
Each node in the Bayesian network has condition probability distribution P(Xi |Parent(Xi) ), which determines the effect of the parent on that node.
Bayesian network is based on Joint probability distribution and conditional probability. So let's first understand the joint probability distribution:
Joint probability distribution:
If we have variables x1, x2, x3,....., xn, then the probabilities of a different combination of x1, x2, x3.. xn, are known as Joint probability distribution.
P[x1, x2, x3,....., xn], it can be written as the following way in terms of the joint probability distribution.
= P[x1| x2, x3,....., xn]P[x2, x3,....., xn]
= P[x1| x2, x3,....., xn]P[x2|x3,....., xn]....P[xn-1|xn]P[xn].
In general for each variable Xi, we can write the equation as:
P(Xi|Xi-1,........., X1) = P(Xi |Parents(Xi ))
Explanation of Bayesian network:
Let's understand the Bayesian network through an example by creating a directed acyclic graph:
Example: Harry installed a new burglar alarm at his home to detect burglary. The alarm reliably responds at detecting a burglary but also responds for minor earthquakes. Harry has two neighbors David and Sophia, who have taken a responsibility to inform Harry at work when they hear the alarm. David always calls Harry when he hears the alarm, but sometimes he got confused with the phone ringing and calls at that time too. On the other hand, Sophia likes to listen to high music, so sometimes she misses to hear the alarm. Here we would like to compute the probability of Burglary Alarm.
Problem:
Calculate the probability that alarm has sounded, but there is neither a burglary, nor an earthquake occurred, and David and Sophia both called the Harry.
Solution:
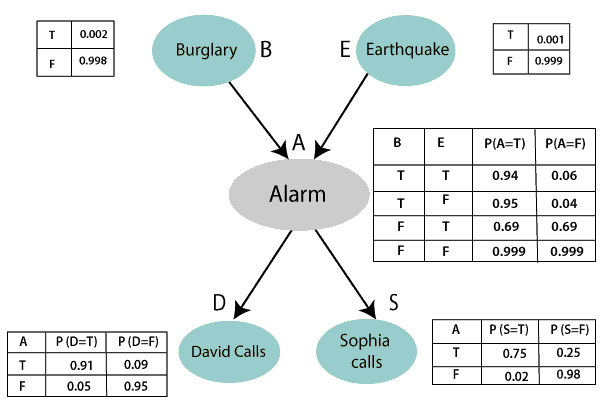
- The Bayesian network for the above problem is given below. The network structure is showing that burglary and earthquake is the parent node of the alarm and directly affecting the probability of alarm's going off, but David and Sophia's calls depend on alarm probability.
- The network is representing that our assumptions do not directly perceive the burglary and also do not notice the minor earthquake, and they also not confer before calling.
- The conditional distributions for each node are given as conditional probabilities table or CPT.
- Each row in the CPT must be sum to 1 because all the entries in the table represent an exhaustive set of cases for the variable.
- In CPT, a boolean variable with k boolean parents contains 2K probabilities. Hence, if there are two parents, then CPT will contain 4 probability values
List of all events occurring in this network:
- Burglary (B)
- Earthquake(E)
- Alarm(A)
- David Calls(D)
- Sophia calls(S)
We can write the events of problem statement in the form of probability: P[D, S, A, B, E], can rewrite the above probability statement using joint probability distribution:
P[D, S, A, B, E]= P[D | S, A, B, E]. P[S, A, B, E]
=P[D | S, A, B, E]. P[S | A, B, E]. P[A, B, E]
= P [D| A]. P [ S| A, B, E]. P[ A, B, E]
= P[D | A]. P[ S | A]. P[A| B, E]. P[B, E]
= P[D | A ]. P[S | A]. P[A| B, E]. P[B |E]. P[E]

Let's take the observed probability for the Burglary and earthquake component:
P(B= True) = 0.002, which is the probability of burglary.
P(B= False)= 0.998, which is the probability of no burglary.
P(E= True)= 0.001, which is the probability of a minor earthquake
P(E= False)= 0.999, Which is the probability that an earthquake not occurred.
We can provide the conditional probabilities as per the below tables:
Conditional probability table for Alarm A:
The Conditional probability of Alarm A depends on Burglar and earthquake:
| B | E | P(A= True) | P(A= False) |
|---|---|---|---|
| True | True | 0.94 | 0.06 |
| True | False | 0.95 | 0.04 |
| False | True | 0.31 | 0.69 |
| False | False | 0.001 | 0.999 |
Conditional probability table for David Calls:
The Conditional probability of David that he will call depends on the probability of Alarm.
| A | P(D= True) | P(D= False) |
|---|---|---|
| True | 0.91 | 0.09 |
| False | 0.05 | 0.95 |
Conditional probability table for Sophia Calls:
The Conditional probability of Sophia that she calls is depending on its Parent Node "Alarm."
| A | P(S= True) | P(S= False) |
|---|---|---|
| True | 0.75 | 0.25 |
| False | 0.02 | 0.98 |
From the formula of joint distribution, we can write the problem statement in the form of probability distribution:
P(S, D, A, ¬B, ¬E) = P (S|A) *P (D|A)*P (A|¬B ^ ¬E) *P (¬B) *P (¬E).
= 0.75* 0.91* 0.001* 0.998*0.999
= 0.00068045.
Hence, a Bayesian network can answer any query about the domain by using Joint distribution.
The semantics of Bayesian Network:
There are two ways to understand the semantics of the Bayesian network, which is given below:
1. To understand the network as the representation of the Joint probability distribution.
It is helpful to understand how to construct the network.
2. To understand the network as an encoding of a collection of conditional independence statements.
It is helpful in designing inference procedure.
Ques. Write a short note on Bayesian network.
Or
Explain the Bayesian network by taking an example . How is the Bayesian network representation for uncertainty knowledge ?
Answer:
- A Bayesian network is a probabilistic graphical model(PGM) which represents a set of variables and their conditional dependencies using a directed acyclic graph(DAG).
- These networks are built from a probability distribution, and also use probability theory for prediction and anomaly detection.
- Each variable is associated with a conditional probability table which gives the probability of this variable for different values of the variables on which this node depends.
- Using this model, it is possible to perform inference and learning.Bayesian networks that model a sequence of variables varying in time are called dynamic Bayesian networks
- Bayesian networks with decision nodes which solve decision problems under uncertainly are Influence diagrams.
Explicit representation of conditional independencies Missing arcs encode conditional independence Efficient representation of joint PDF P(X) Generative model (not just discriminative): allows arbitrary queries to be answered,
e.g. P (lung cancer=yes | smoking=no, positive X-ray=yes ) = ?
For example, a Bayesian network could represent the probabilistic relationships between diseases and symptoms. Given symptoms, the network can be used to compute the probabilities of the presence of various diseases. Efficient algorithms can perform inference and learning in Bayesian networks.
Another Example:
Applications:
- Prediction
- Anomaly detection
- Diagnostics
- Automated insight
- Reasoning
- Time series prediction
- Decision making under uncertainty.
Ques. Explain the role of prior probability and posterior probability in bayesian classification.
Answer:
Prior Probability:
Bayesian statistical inference is the probability of an event before new data is collected.This is the best rational assessment of the probability of an outcome based on current knowledge.
It shows the likelihood of an outcome in a given dataset.
For example,
In the Mortgage case, P(Y) is the default rate on a home mortgage, which is 2%. P(Y|X) is called the conditional probability, which provides the probability of an outcome given the evidence, that is, when the value of X is known.
Posterior Probability:
It is calculated using Bayes’ Theorem.Prior probability gets updated when new data is available,to produce a more accurate measure of a potential outcome.
A posterior probability can subsequently become a prior for a new updated posterior probability as new information arises and is incorporated into the analysis.
Ques. Explain the method of handling approximate inference in Bayesian networks.
Answer:
Inference over a Bayesian network can come in two forms. The first is simply evaluating the joint probability of a particular assignment of values for each variable (or a subset) in the network
In exact inference, we analytically compute the conditional probability distribution over the variables of interest.
Methods of handling approximate inference in Bayesian Networks:
Simulation Methods:
It uses the network to generate samples from the conditional probability distribution and estimate conditional probabilities of interest when the number of samples is sufficiently large.
With machine learning, the inputs are known exactly, but the model is unknown prior to training. Regarding output, the differences are more subtle. Both give an output, but the source of uncertainty is different.
Variational Methods:
Variational Bayesian methods are a family of techniques for approximating intractable integrals arising in Bayesian inference and machine learning.


No comments:
Post a Comment